What is it?
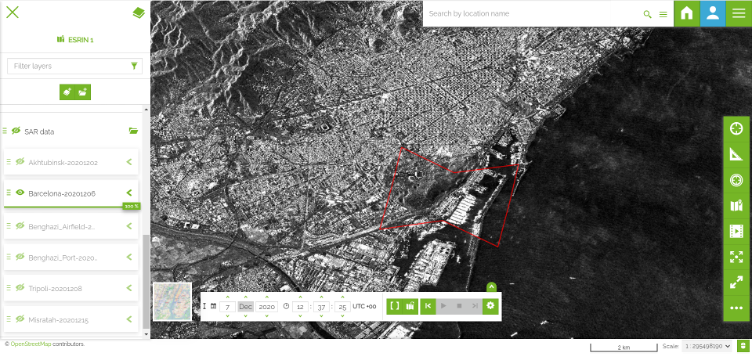
We provide customers with a Geospatial Portal based on the Earth-I SPECTRUM platform. This portal allows users, with ease, to discover, analyse and report on remotely sensed data, particularly satellite imagery.
Users don’t need a deep understanding of GIS and satellite imagery to use the portal; it is as easy to use as Google Earth.
How is it used
The portal provides easy-to-access geospatial information and is used by professionals around the globe, for example to assist with construction and infrastructure projects.
Once a user is at ease with the system, they can create their own reports from the analytics already available or customise them with the toolset provided. The platform runs on a standard personal computer through an internet browser, preferably Google Chrome and no specialist software or training is required.
Various data feeds can be presented in the platform including:
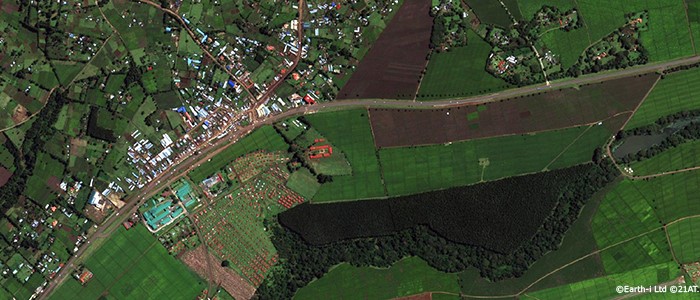
- 2D georeferenced imagery of any resolution and from any source
- 3D height modelling data, surface, bare ground and slope
- Wide area ground movement data derived from satellite radar
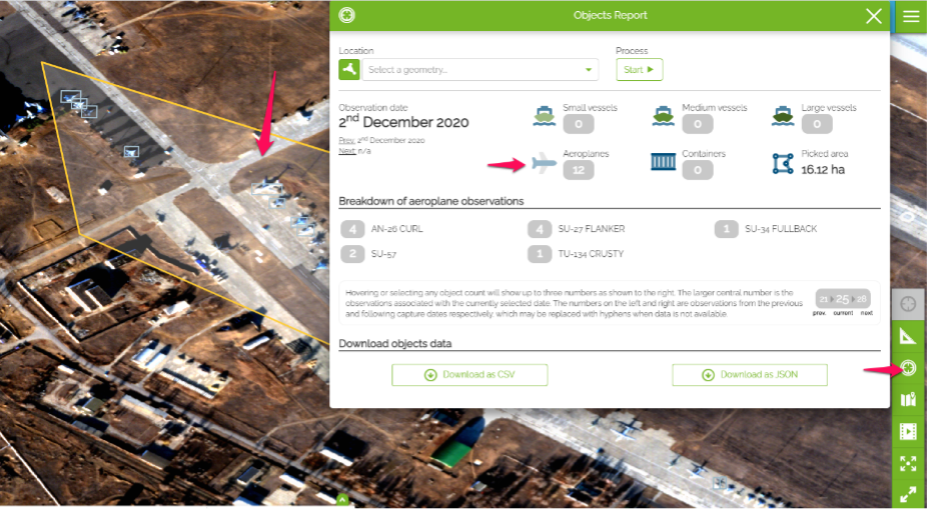
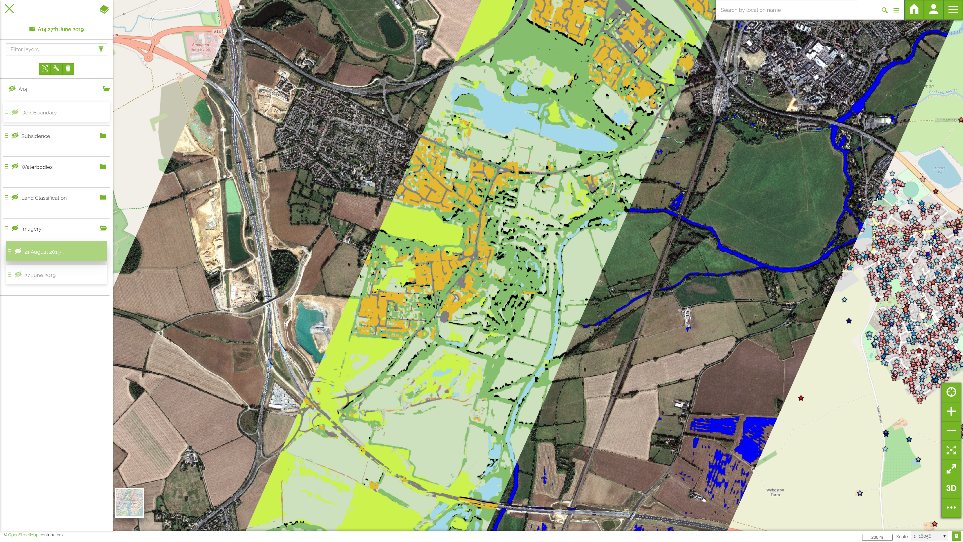
- Automatically and manually derived data layers such as land cover, objects detected from imagery and others
- Changes between these layers over time, created through geoprocessing and then displayed on the map
- Reference layers such as protected sites, publicly available mapping and reference imagery and customer supplied vector layers
Tools are provided to analyse the data feeds and are customised to the sites under study, allowing the user to interpret the layers and create their own reports for example:
- Add annotations to the map and save them
- Change the transparency of layers
- Scroll through timeline and watch the changes appear on the map
- Create statistics of land cover or land cover change
- Create charts of ground movement change