Supporting environmental analysis in Australia with multi-spectral satellite data.

The client challenge – local environmental understanding
The client had responsibility for a large metropolitan area within Australia and needed our satellite mapping capability to understand local tree canopy, urban heat islands, greenspace and surface permeability in greater detail for planning purposes.
Environmental analysis, urban development and exploration of the relationships between urban heat and vegetation were all major concerns for the client that Earth-i was commissioned to support with.
Our solution – utilising multi-spectral data
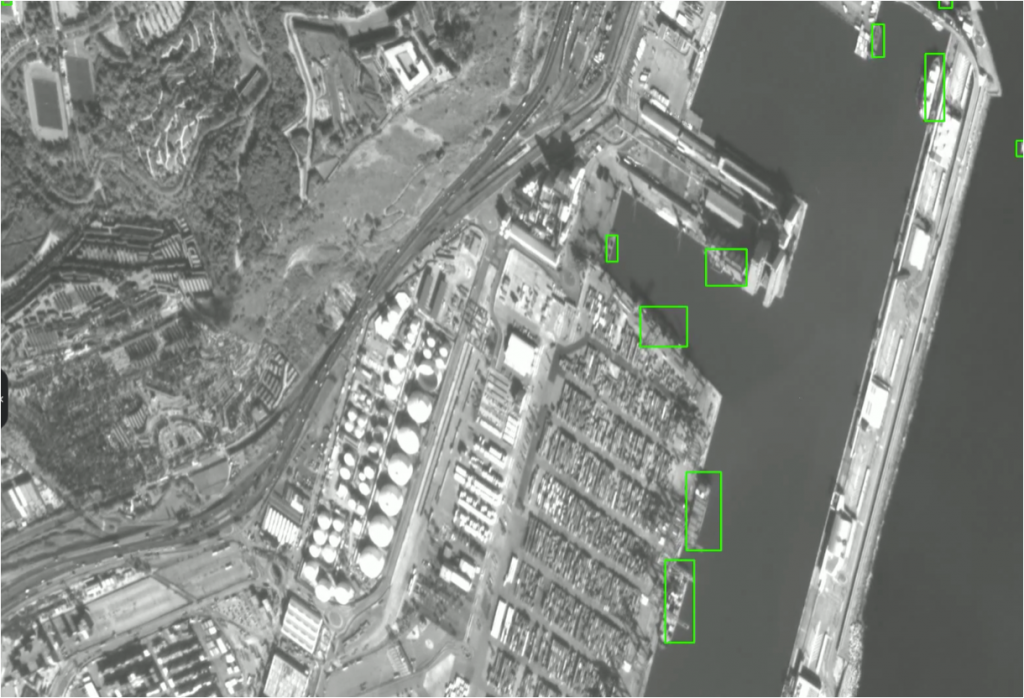
We provided multi-spectral satellite data covering the entire metropolitan region’s infrastructure. This included panchromatic imagery at 50cm native resolution and blue/green/red/near-infrared imagery at 2m native resolution.
| Spectral Band | Spectral Bandwidth (nm) |
| Panchromatic | 450 – 700 |
| Blue | 450 – 520 |
| Green | 520 – 590 |
| Red | 630 – 690 |
| Near Infrared | 770 – 890 |
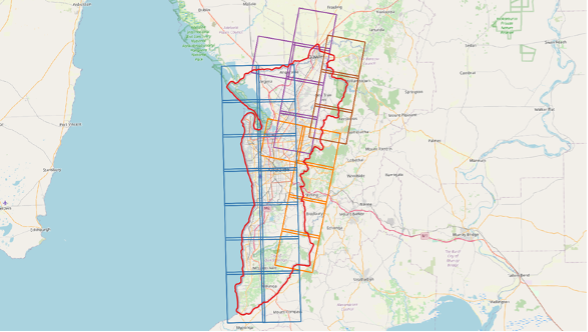
Images were acquired across four dates in order to provide total coverage with minimised viewing angle to the target and to mitigate the cloud cover.
The data was processed using a number of techniques, including:
- Radiometric Correction: adjusting image brightness and contrast.
- Orthorectification: correcting geometric distortions in imagery.
- Pansharpening: enhancing spatial resolution using panchromatic data.
- Atmospheric Correction: removing atmospheric effects like haze.
- Mosaic: stitching multiple images into one seamless map.
- Normalized Difference Vegetation Index (NDVI): assessing vegetation health and density.
The project involved comprehensive planning and tasking to collect satellite imagery data over the designated area of interest. Following the acquisition, the data underwent pre-processing and orthorectification to ensure that all scenes were geometrically accurate and corrected for any distortions. This crucial step provided a precise foundation for further processing and integration.
The orthorectified images were then mosaicked and colour-balanced to create a seamless orthomosaic, ensuring uniformity across the entire dataset. These images and the resulting mosaic were subsequently reprojected and tiled according to the specified projections. The final outputs were prepared with the required band order and metadata, aligning them with the project’s technical and application-specific requirements.
The outcome – enhanced planning precision for the local community
Government planners and other stakeholders were able to use the data in a number of ways to support the local community, including:
- Conducting and environmental analysis
- Understanding vegetation greenness and health applications
- Supporting analyses based on LiDAR tree canopy and thermal data acquisitions to explore relationships between urban heat and vegetation
- Providing a background layer in various maps for internal use and integrated in internal and public facing web applications
- Contributing to urban development applications
- Use by Contractors providing services to project stakeholders