Multiple customers benefit from our insight service
A large number of customers use our Metals Smelting insight service, Savant.
How we provide the service
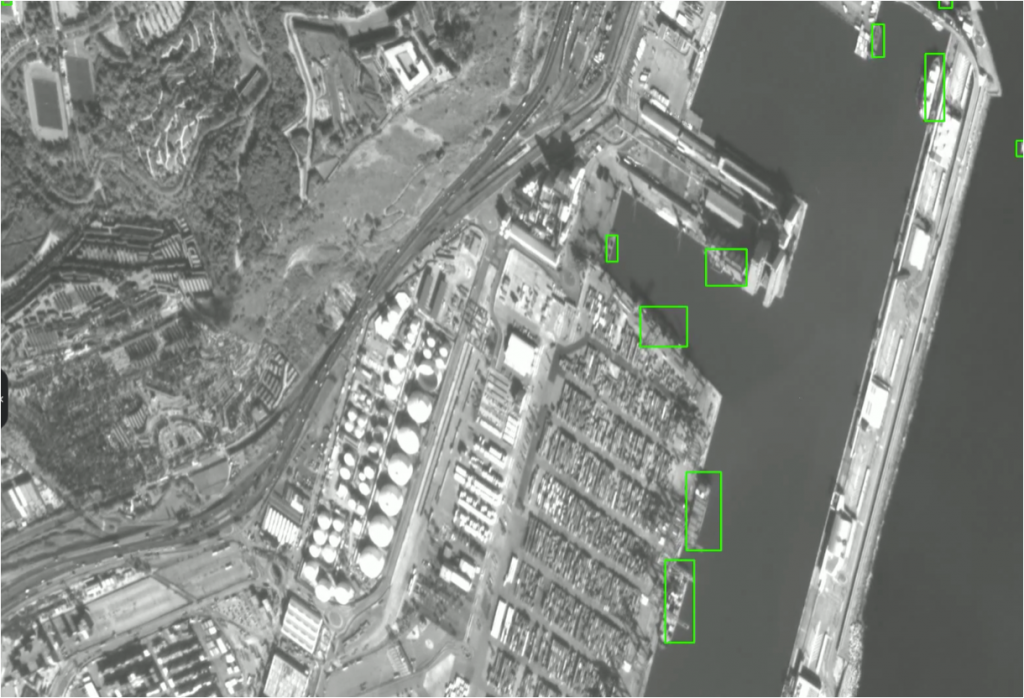
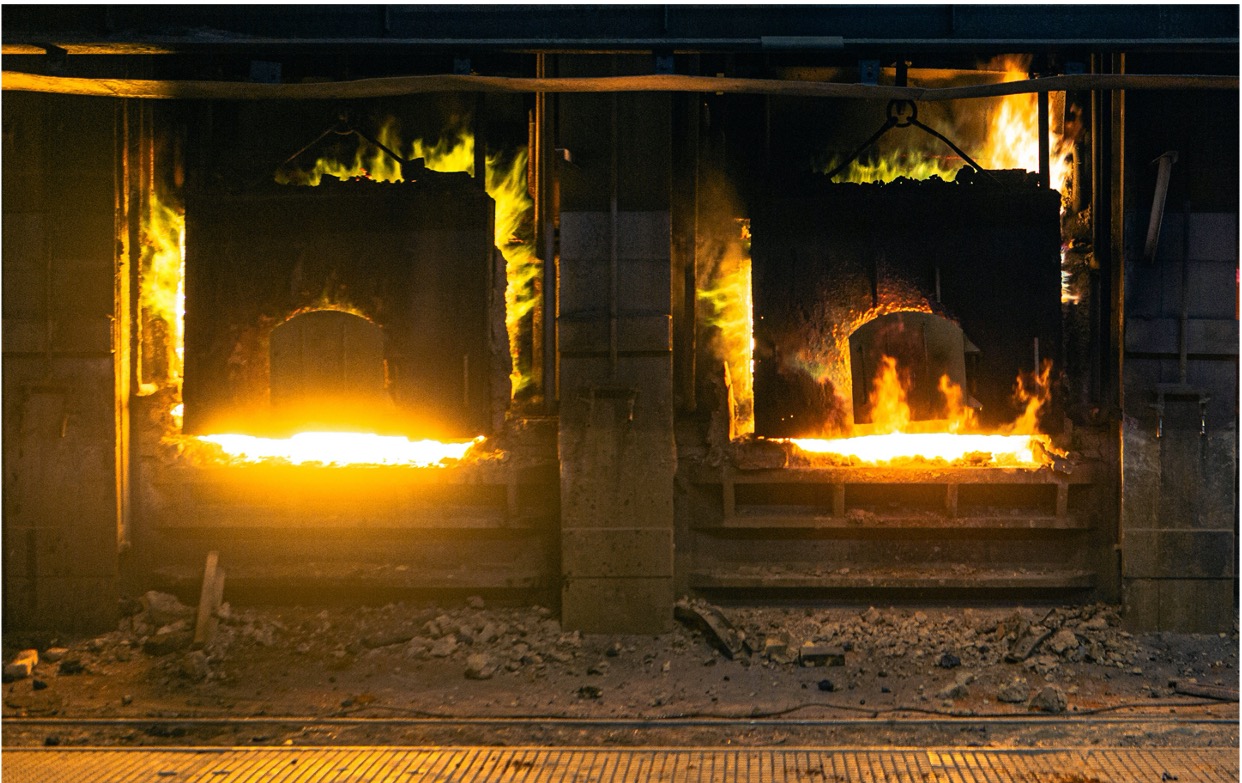
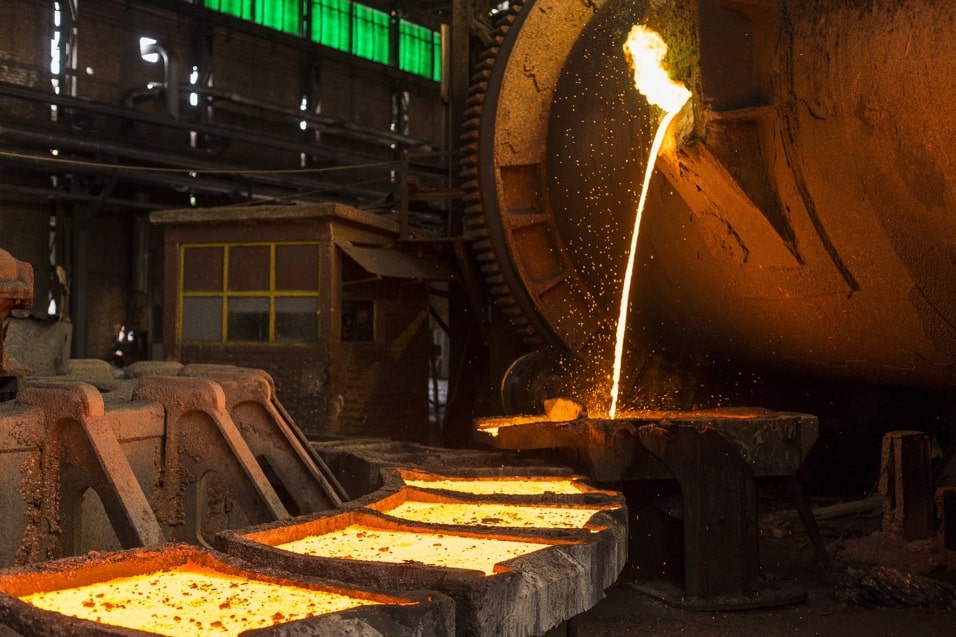
Earth-i uses satellite data to monitor copper and nickel smelters around the world, such as the Mount Isa copper smelter in Queensland. The location of smelters is not always publicly available, and in regions where detailed information is unavailable or unreliable, the precise location of the smelters is validated using high-resolution satellite imagery.
How we gather data
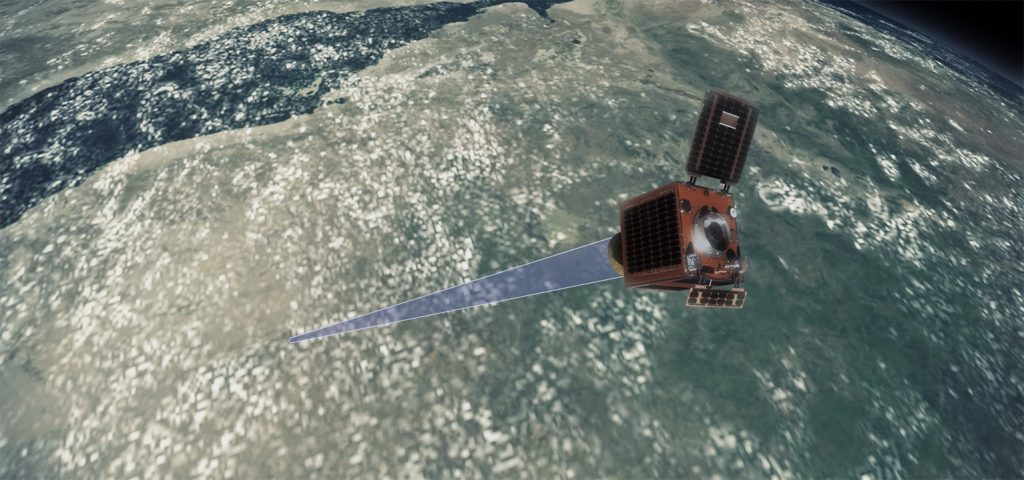
The satellite data is collected from several constellations and includes data from infra-red and visible bands. Computer vision and machine learning techniques are used to detect and measure operational signatures at each individual smelting site. This varies with site layout and smelting technology, so each site undergoes characterisation mapping that is constantly updated. The result is the derivation of separate areas of smelting activity at each site. The number and nature of these will vary over time and can be used to derive the level of activity at the site. Two separate values are created: 1) the Activity Dispersion, which shows the dispersion around the average activity level at the smelter; 2) the Status, which marks the smelter’s operational status as either active or inactive. The Status determines whether a smelter is operational, and the Activity Dispersion provides a measure of how active it is.
What we show
These figures are built into two global indices to provide an overall picture of smelter production. The activity dispersion values for all copper smelters are used to create the Copper Activity Dispersion Index, which reflects worldwide smelter activity.
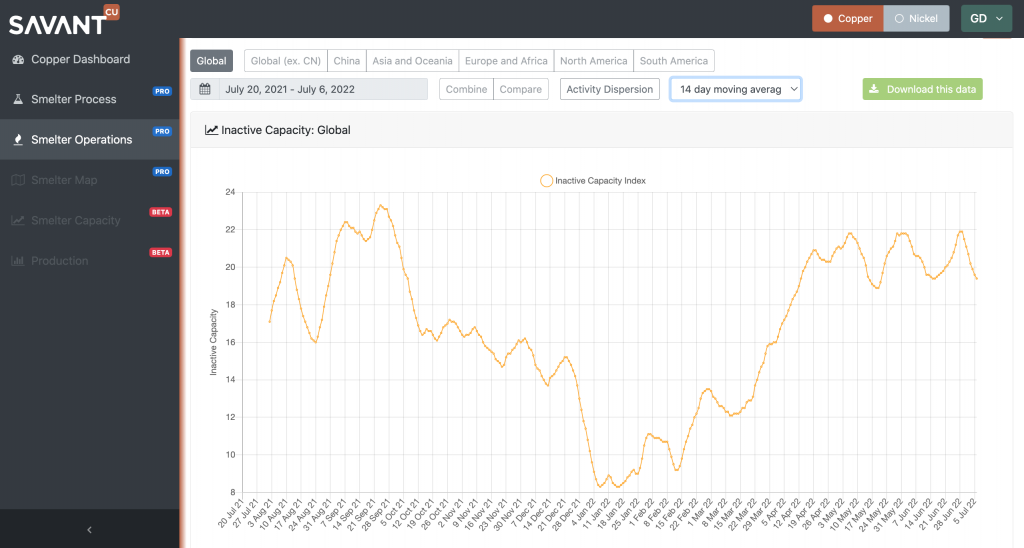
The status values are averaged into the Copper Inactive Capacity Index, which shows the percentage of global smelter capacity that is inactive at any one time.
The smelters included in the global index make up approximately 70% of the world’s copper smelting capacity and 85% of Chinese smelting capacity, based on International Copper Study Group figures. Equivalent indices are also created for nickel smelters; in this case, approximately 80% of the world’s smelting capacity is covered. Additional smelters are monitored, but not yet included in the indices because their measured characteristics are not consistent enough to pass Earth-i’s quality assurance process.
Regional and Country indices
Regional and country indices for each are also provided – depending on service level – which cover the smelters within particular regions and countries. Multiple regions or countries can be combined to create a Combined Index. All the indices are updated daily.
Each index is normalised to show a value between 0 and 100.
Activity Dispersion Index
The Activity Dispersion Index is centred around an average level of 50 to show peaks and troughs in activity (note that the 50 value does not mean the smelter is 50% active).
Inactivity Capacity Index
The Inactive Capacity Index would show 0 if all smelters were active (and 100 in the unusual situation they were all inactive). Each smelter’s contribution to the index is scaled based on its theoretical tonnage capacity, so a large capacity smelter contributes proportionally more than a smaller one.
In the simplest terms, the higher the Activity Dispersion Index and the lower the Inactive Capacity Index, the more evidence of smelter activity is apparent.
Individual smelter data is also available through the Smelter Map page, dependent on service level. This includes the historical status of smelters going back to early 2016; and KML files, which can be used with a GIS program such as Google Earth to show site-specific details.