17 October 2024 – London – For the fourth consecutive month global smelting activity increased in September according to Earth-i‘s SAVANT Global Copper Monitoring Index, with average smelter inactivity falling by a full percentage point m/m to 14.2%. This monthly decline contributed to smelters being 1.6% more active on average in Q3 2024 than the same period a year ago. It would therefore seem that despite very low terms in the spot market, record high gold as well as resurgent copper prices are proving sufficient to incentivise operators to keep processing scarce concentrates.
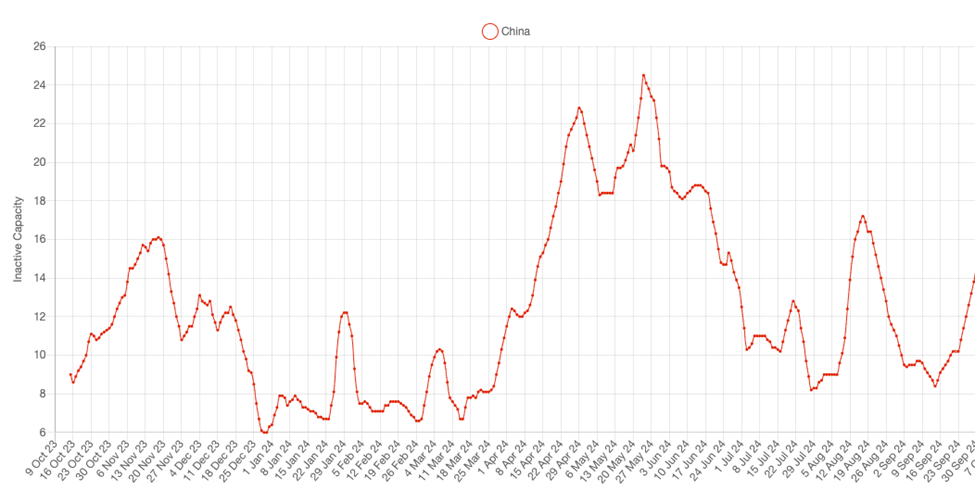
The fall in the global index was in large part due to a 2.1% decline in China, where average inactivity fell from 12.8% to 10.7%, the lowest reading since March. This is highly unusual for this time of year when smelters enter negotiations for next year’s annual benchmark terms, and speaks to the duress they face as a cohort that we highlighted in our recent feature article – ‘Damned if they do, damned if they don’t?‘. Not surprisingly, the country level fall was mirrored by that of the custom smelter monitoring index, which shed 2.2% to 11.4%, as 54% of all operating custom smelters are located in China.
A rise in inactivity towards the end of the month may indicate that some operators have heeded calls from members of the China Smelter Purchasing Team (CSPT) for production cuts and maintenance extensions. The largest contributors to the recent uplift have been the northeast and south central regions, the latter where the large Daye Hongsheng (400 kt/a) plant is located that will be closed for 3 months, following a fire that broke out in the sulphuric acid plant on September 14th. In the northeast of the country, the Fubang (40 kt/a) and Jilin Zijin (150 kt/a) smelters were the main contributors, although the later was recorded as active again on October 8th.
Fig I: Smelter inactivity in China: October 2023 – Present
Across other regions, the largest fall in smelting activity (as deduced by a rise in inactivity) was seen in Europe, where the regional monitoring index rose by 9.2% to 28.3%. In addition to the major maintenance and upgrading work being undertaken at Glogow (540 kt/a) that has seen the continent’s largest smelter offline since the middle of August, towards the end of the month weaker signals from the region’s second largest Hamburg smelter (450 kt/a) also assisted the rise.
Elsewhere, inactivity remains highest in Africa at an average of 44.6% for September, despite finishing the month at 28.9%, while Asia & Oceania cemented its status as the region with the highest level of operating activity, where the inactivity index fell by 4.7% m/m to just 2.1%. Here only the Ust-Kamenogorsk smelter (70 kt/a) in Kazakhstan joined Samsun (80 kt/a) in Turkey as showing any significant period of inactivity.
Fig II: Smelter inactivity in Africa and Asia & Oceania: April 2024 – Present
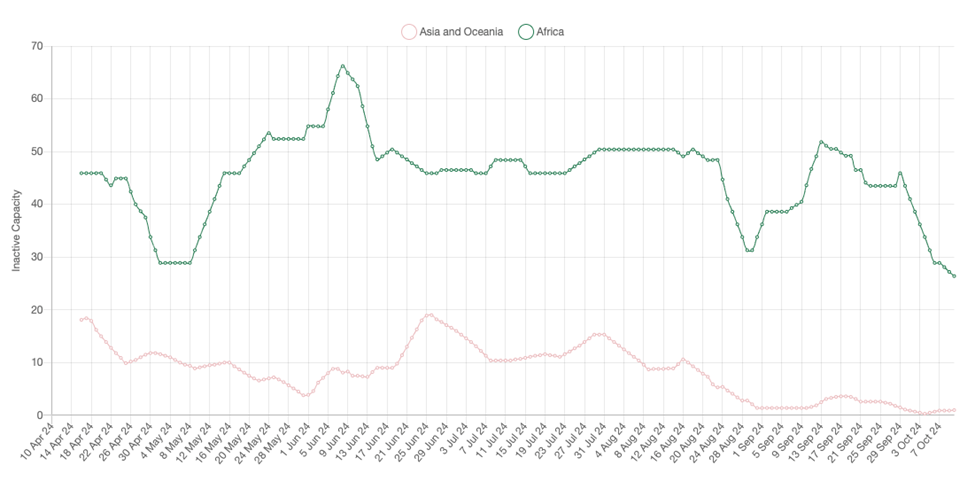
Meanwhile in Asia & Oceania the decline of the regional inactive capacity index, from an already low 12.8% to only 6.8%, spoke to a very strong operating performance for many facilities, including both Australian smelters at Olympic Dam and Mount Isa, the Japanese smelters at Onahama, Saganoseki and Tomano, while all of the smelters in Kazakhstan also displayed robust activity profiles. Indeed, it was only the relatively small 80 Kt/a Samsun smelter in Turkey that was registered offline at the beginning of the September, part of what appears to be an extended maintenance campaign.
Fig III: Smelting activity, selected smelters
Daye Hongsheng, China
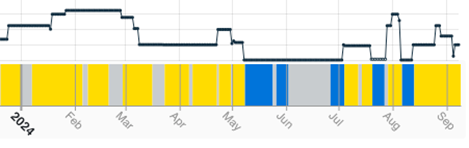
Fubang, China
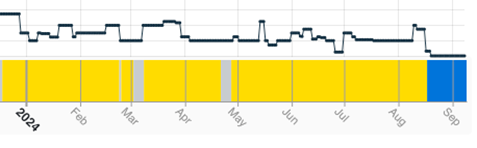
Ust-Kamenogorsk, Kazakhstan
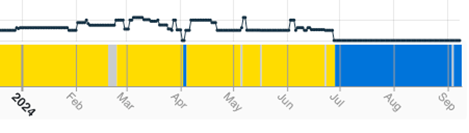
Yellow = Active / Blue = Inactive / Grey = No reading
See more about Earth-i’s SAVANT Global Copper Monitoring Index here.
About SAVANT:
Earth-i’s SAVANT platform monitors up to 95% of the smelting capacity for copper and nickel around the globe and provides indicators of smelter activity and production around the globe, in an easy-to-understand format, covering multiple metals and minerals.
Data is collected and analysed using advanced algorithms derived from Computer Vision and Machine Learning techniques. Data is taken from several different Earth Observation satellites and our global and regional indices are updated at a high frequency to give consistent, insightful and dependable results.
Activity is scientifically measured using a consistent methodology. Over eight years of historical data is available.
About Earth-i:
Earth-i is a geospatial intelligence company using machine learning, artificial intelligence and Earth Observation data to provide unique and relevant insights, derived from diverse geospatial data, that deliver clear decision advantage for businesses, governments and other organisations.
Earth-i provides advanced analytics using automated interpretation of a range of geospatial Earth Observation data sources including colour imagery, colour video, infra-red and radar from a range of sources including satellite, drone, aerial and ground-based sensors. This data is fused with additional data sources to extract factual understanding and generate predictive insights across a range of markets such as commodities, supply chain, agriculture, infrastructure and defence.
For more information visit:
Email: savant@earthi.co.uk / Website: www.earthi.space / LinkedIn: Earth-i