Our SAVANT Global Metals Monitoring Index indicated that global copper smelting activity increased in March, with the percentage of total capacity registered as inactive falling by 0.4% to 11.7%.
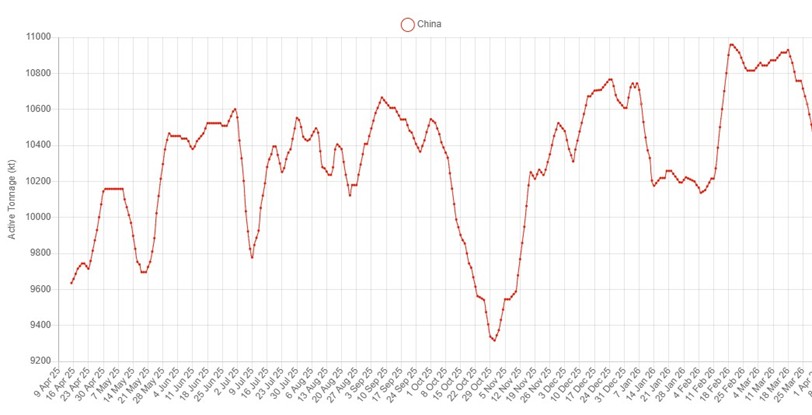
Similar to February, China was the driver of the improvement, with the country-level inactive capacity sub-index in SAVANT falling by 1.1% to just 3.9%. Together with the continuing build out of smelting capacity on the mainland, this resulted in an all-time high active capacity reading of 10.73 Mt, more than 775 kt/a higher than a year ago and 1.49 Mt above the 3-year average.
At a regional level, smelting in East and South Central China saw gains of 3.3% and 1.7%, so that activity in these important hubs is now 4.3% and 6.9% stronger respectively than a year ago. This speaks to the improvement in downstream activity in recent weeks, as demand recovers following a ‘buyer’s strike’ in response to record high copper prices in January that has also seen imports from the international market slump.
Fig I: SAVANT China Active Tonnage Series, March 2025 – Present
For the RoW, the most striking development has been the recent lack of operational signals observed by SAVANT monitoring at the two Iranian smelters, being 280 kt/a Sarchesmeh and 120 kt/a Khatoon Abad, both in Kerman province. The former has been offline since March 28th with the latter appearing to shutter in the first week of April. While it is not unusual for both plants to go down for routine maintenance, in previous years these have tended towards the third quarter, with Sarchesmeh in particular showing regular interruptions to activity in July each year.
These outages, together with that ongoing at the 300 kt/a Mount Isa smelter in Queensland, Australia helped keep the Asia & Oceania regional inactivity sub index elevated at 18.7%, well above its 3-year average of only 5.7%.
Fig II: Map of Iranian smelters
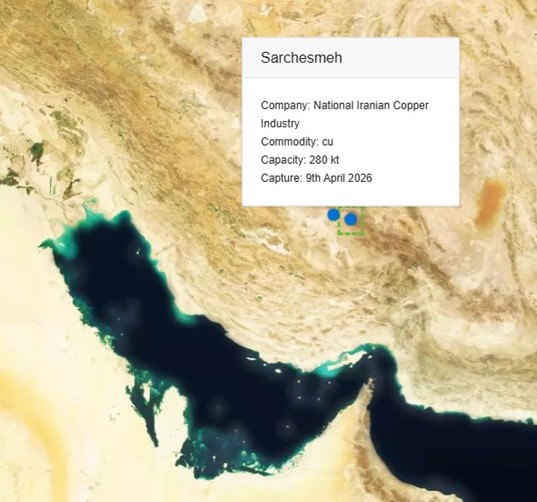
Yellow = active, blue = inactive
Elsewhere smelting activity fell in all regions except Africa, where it was notable that all of the smelters in the Copperbelt recorded relatively strong operating profiles. While inactivity did tick up modestly in Europe by 2.1%, it remains the region with the lowest average percentage of inactive capacity at 6.2%. Meanwhile smelting continues to be weakest in the western hemisphere, with the inactive capacity sub-index for North America rising by 10.3% in March to 32.3%, moving above that of South America at 27.4%, so that it is now the region with the weakest level of smelting activity on average.