The real value of satellite data in supply chains lies in its ability to validate and test claims against what is really happening on the ground. It helps organisations build a more complete picture of how a supply chain is functioning, where risk is building and whether reported information is credible.
Operational status and asset utilisation
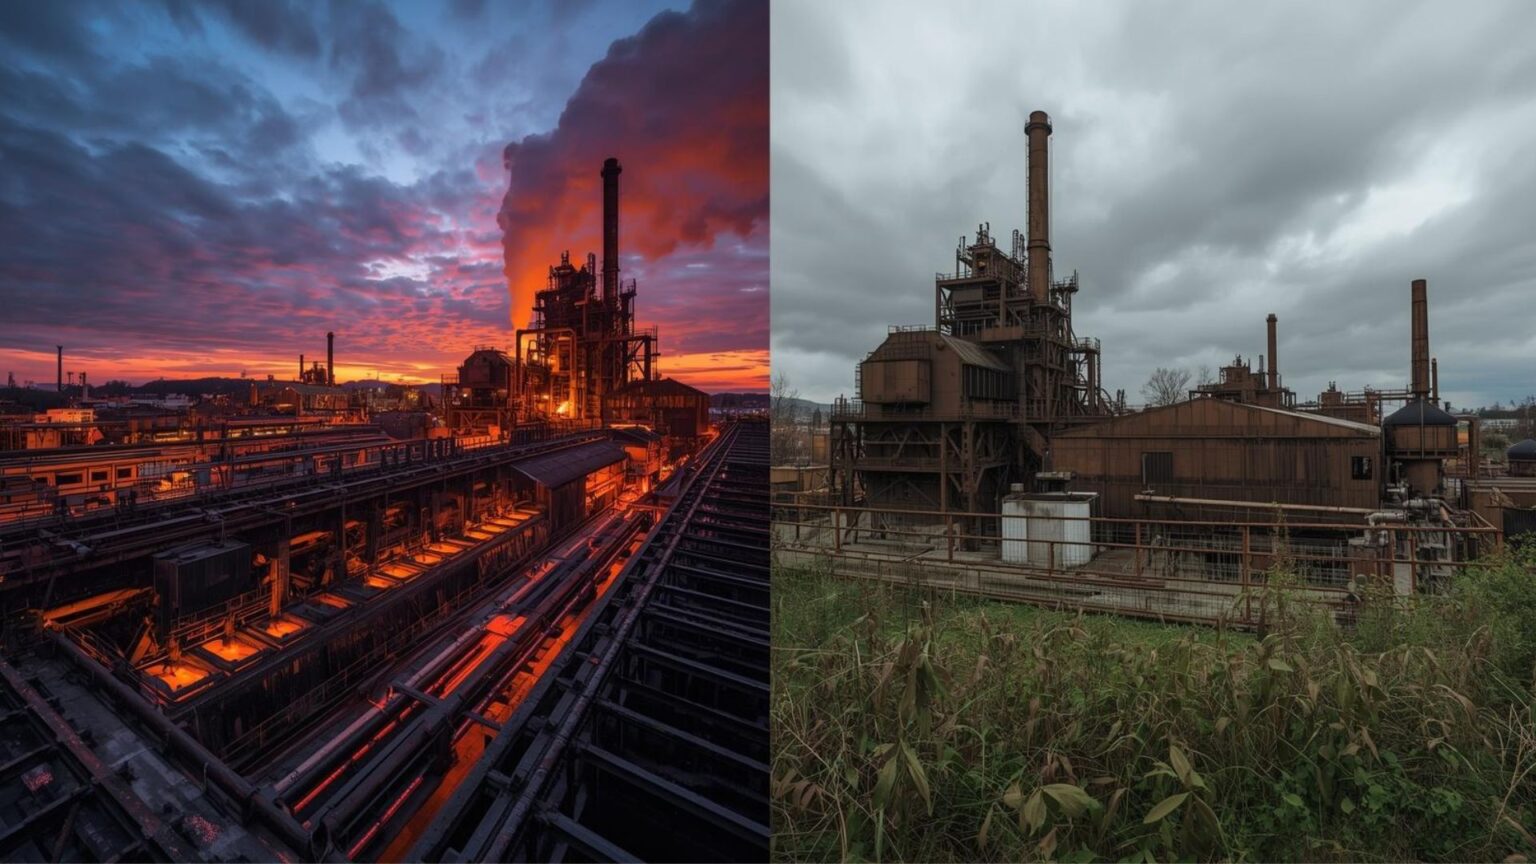
Is an asset genuinely operating as claimed?
This simple question is often the foundation for everything else. If you are relying on a supplier for a critical delivery and they say their facility is active, ramping up, or running at normal rates, satellite data can help assess whether the physical evidence supports that statement.
High-resolution optical imagery can reveal traffic movements, material handling, new stockpile formations, visible emissions and other signs of activity. Radar adds value where cloud cover is persistent and can help track structural change and movement patterns over time.
This allows companies to ask practical questions. Is a plant or factory active or dormant? Is a mine operating continuously or intermittently? Has an announced restart actually happened? Is a site being maintained, expanded, or quietly abandoned? Is a facility operating when its license has been revoked?
Answers to these questions affect procurement decisions, financing assumptions and exposure to supply disruption. In sectors where site access is limited and self reporting can be selective, satellite observation provides a comprehensive and unbiased external check.
Further satellite imagery provides the ability to go back in time and provide up to a 10-year history of change to understand past activity and production rates.
Production intensity and capacity credibility
Is claimed facility output credible?
A supply chain participant may report a production level, a capacity figure or a ramp up timetable, but those claims are only useful if they are physically plausible. Satellite data can help test that.
In the mining industry, for example, imagery can show the pace of pit expansion, waste movement, ore extraction and haul road usage. At a processing site, it can indicate whether stockpiles are growing or shrinking and whether new infrastructure has been installed. Examining these issues over time is especially powerful because trends matter more than snapshots. A site may appear busy on a single date yet still be underperforming over a quarter.
This theme supports questions such as: has production increased or slowed, are capacity claims realistic, and can the supplier reasonably meet contracted volumes? It also helps distinguish between nameplate capacity and actual operating performance. That distinction is critical in commodity markets, where over optimistic production claims can distort pricing, forecasting and risk assessment long before the shortfall becomes obvious in reported volumes.
Logistics, trade flows and origin verification
Does claimed output and delivery estimates match material movement trends?
Supply chains depend on the movement of material from source to processing plant, from plant to port and from port to end market. Satellite data becomes especially powerful when combined with vessel tracking, rail patterns, road access analysis and port activity.
This makes it possible to explore whether a shipment likely originated where the paperwork says it did. If a cargo is declared as coming from a specific region or facility, geospatial analysis can help test whether that origin is consistent with the observed logistics chain. Are there visible flows from a mine to a terminal, for example? Do stockpile patterns at the export point align with the claimed source? Are the loading patterns at the port consistent with the supplier’s stated production? Are vessels calling at locations that make the declared trade route plausible?
Answers to these questions can impact sanctions screening, tariff treatment, traceability, responsible sourcing claims and carbon accounting. A supply chain that looks clean on paper may appear far less straightforward when viewed from above.
Environmental footprint and land use change
Is a supplier’s claimed environmental impact credible?
Another major theme is environmental performance. Satellite data is exceptionally strong at showing whether the physical footprint of industrial activity is stable, expanding or becoming more damaging over time.
Time series imagery can reveal growing tailings areas, expanding waste rock dumps, forest loss, increased sedimentation, changing water colour, dust spread and encroachment into protected or sensitive zones. In some cases, it can also show whether mitigation infrastructure such as lined ponds, drainage controls, or buffer zones appears to be present and maintained.
This supports a different class of supply chain question. Are environmental impacts expanding over time? Is the asset’s disturbance footprint consistent with its reported controls? Is land clearance accelerating? Are signs of stress appearing near water systems or communities? These issues matter to responsible sourcing teams, but also to investors, insurers and lenders.
Compliance, carbon exposure and reporting integrity
Is a supplier complying with the relevant industry standards?
Satellite data is relevant where companies face obligations linked to emissions, sustainability disclosures or import regulation. The key issue is whether reported data reflects observable operational reality.
Take carbon exposure. If a buyer is importing material into a regime where embedded emissions matter, then inaccurate assumptions about production levels, process routes, asset utilisation or origin can create immediate financial risk. A facility that appears to be running harder than disclosed may imply greater emissions intensity or larger exposure than expected. A shipment whose real source differs from its declared source may carry a different carbon profile altogether.
Satellite data helps answer questions such as: are reported production volumes credible, are contract commitments physically plausible and do claimed sourcing patterns make sense considering observable infrastructure and trade flows? That matters under mechanisms such as the Carbon Border Adjustment Mechanism, where mistakes in embedded emissions accounting can become costly very quickly.
Satellite data brings breadth and consistency to major supply chain questions. It allows the same questions to be asked repeatedly across many assets and jurisdictions. That creates a common evidence base for procurement, due diligence, compliance and risk management.