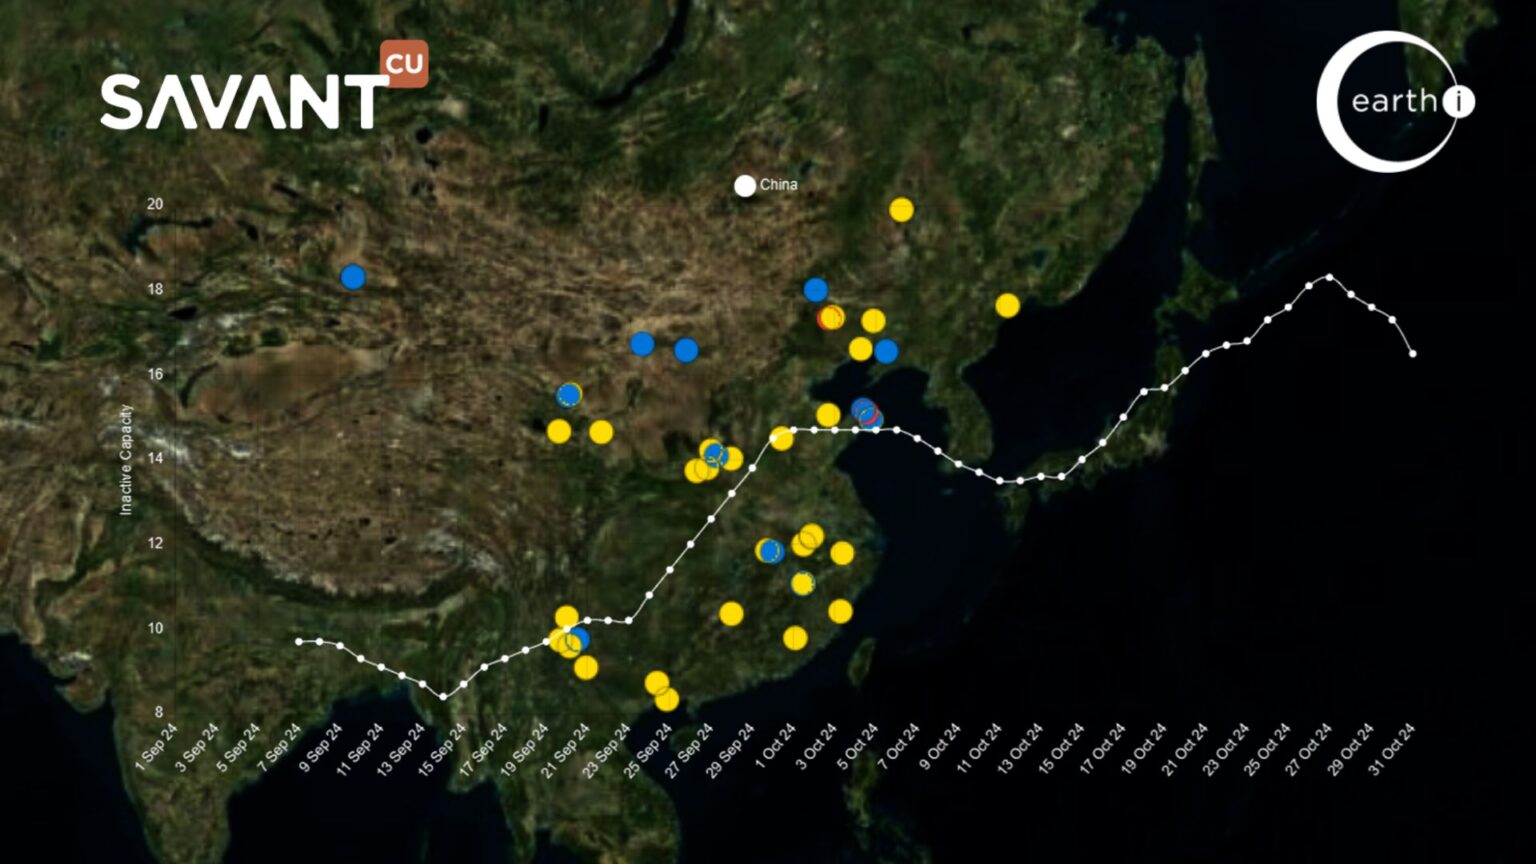
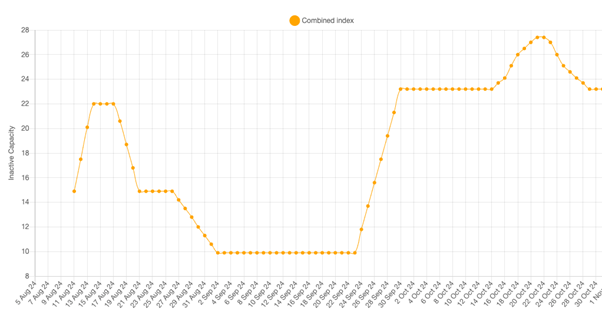
12 November 2024 – London – Smelting activity fell in October according to Earth-i‘s SAVANT Global Copper Monitoring Index, with average smelter inactivity increasing by 1.9% m/m to 16.1%, the highest reading since June. This was overwhelmingly due to a 4.8% m/m slump in smelting activity in China (as deduced from a rise in inactivity of 4.8% m/m to 15.5%), the largest m/m decline since April when smelters typically shut down for maintenance. As a result, smelter inactivity in the country now stands 4.7% higher than the same period a year ago. This is an indication of the economic pressures facing custom smelters we noted last month, that had prompted calls from the China Smelter Purchasing Team (CSPT) for production cuts and maintenance extensions.
Within China, regional differences are pronounced with the weighted average inactivity of smelters in the North and Northeast of the country seen at an average of 20.9% for October, while the combined South Central and Southwest regions are at 24.3%. That the country-level figure is so much lower is due to the health of smelting activity in East China, which accounts for 45% of country level production. Here average inactivity for the month was only 6%, despite the 180 kt/a Yantai Guoxing smelter joining the 100 kt/a Humon_2 plant as inactive in Shandong province.
Fig I: China South Central and Southwest smelter inactivity, August – October 2024
In addition to China, smelting activity also declined in North America where the regional inactivity index rose by 11.9% to 39.8%. However, because North America accounts for only around 6% of global capacity, on a weighted average basis its influence on the global inactivity index was only around a third that of China. Nonetheless, this is important in the context of COMEX copper prices, as we explored in our recent feature article ‘Could copper prices spike again?‘. Much of the rise can be attributed to patchiness in activity observed at the Copper Cliff and Sudbury (Xstrata) smelters in Ontario, Canada.
The rise in the global inactivity index would even have been larger were it not for an increase in activity of 17.7% in Africa and 7.5% in Europe, which account for 6% and 12% respectively of SAVANT coverage. Most notably, the 310 kt/a Nchanga smelter was observed active for the first time in nearly a year following Vedanta’s resumption of control at the site in July.
Meanwhile, activity in South America was stable with the regional inactivity index remaining unchanged at 16.5% m/m, while in Asia and Oceania the index rose by 5.2% m/m, although at an average of only 7.3% in October it remains the lowest of all the regions.
Fig II: Yantai Guoxing smelter activity, 2024 – Present

Fig III: Sudbury Copper Cliff smelter activity, July 2024 – Present
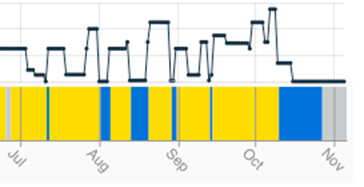
Fig IV: Nchanga smelter activity, July 2024 – Present
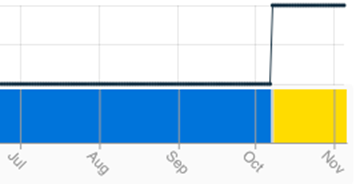
Yellow = Active / Blue = Inactive / Grey = No reading
See more about Earth-i’s SAVANT Global Copper Monitoring Index here.
About SAVANT:
Earth-i’s SAVANT platform monitors up to 95% of the smelting capacity for copper and nickel around the globe and provides indicators of smelter activity and production around the globe, in an easy-to-understand format, covering multiple metals and minerals.
Data is collected and analysed using advanced algorithms derived from Computer Vision and Machine Learning techniques. Data is taken from several different Earth Observation satellites and our global and regional indices are updated at a high frequency to give consistent, insightful and dependable results.
Activity is scientifically measured using a consistent methodology. Over eight years of historical data is available.
About Earth-i:
Earth-i is a geospatial intelligence company using machine learning, artificial intelligence and Earth Observation data to provide unique and relevant insights, derived from diverse geospatial data, that deliver clear decision advantage for businesses, governments and other organisations.
Earth-i provides advanced analytics using automated interpretation of a range of geospatial Earth Observation data sources including colour imagery, colour video, infra-red and radar from a range of sources including satellite, drone, aerial and ground-based sensors. This data is fused with additional data sources to extract factual understanding and generate predictive insights across a range of markets such as commodities, supply chain, agriculture, infrastructure and defence.
For more information visit:
Email: savant@earthi.co.uk / Website: www.earthi.space / LinkedIn: Earth-i

