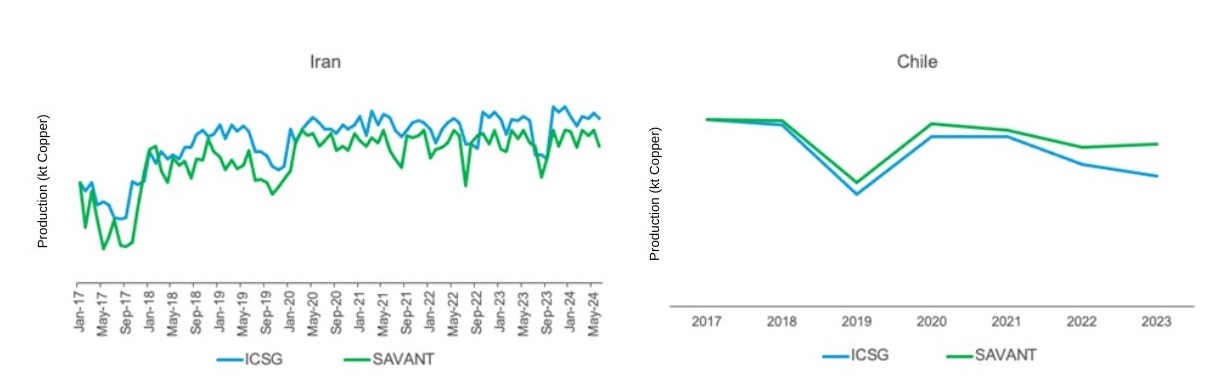
16 October 2024 – London – While the SAVANT Global Copper Monitoring Index is the primary tool with which our customers monitor the global copper industry, we have also been developing a proxy for production that allows users to monitor country, regional and global levels of copper output in real time (see Chart 1 for some examples). Using the satellite data collected from several constellations, which is then capacity weighted and calibrated at a country level against published data for refined metal from the International Copper Study Group (ICSG), the SAVANT Index data has already delivered some fascinating insights in beta phase, not least of which is helping to shed light on events earlier this year that sent copper prices skyrocketing.
Chart 1: SAVANT production series and ICSG reported production (kt copper), Iran (monthly, 2017 – Present) and Chile (annual, 2017 – 2023
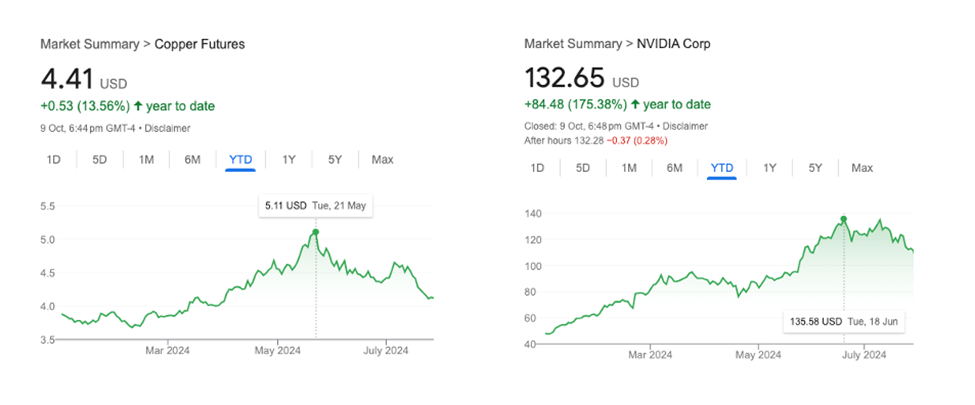
As prices hit all-time highs in May, much of the commentary focused on a couple of physical trading companies, rumoured to be Trafigura and IXM, being caught in a ‘short squeeze’ as the reason for the spike in prices on COMEX, the exchange for the CME Group copper contract in North America. This saw prices in Chicago trade as much as $1,000 /t higher than those in London, hitting a record $5.20 /lb ($11,464 /t) on May 20th. The narrative pitted these specialists against a wall of money inflows from the macro investment crowd seeking to ride the ‘all things AI’ wave that had already seen shares in technology company Nvidia more than double since the beginning of 2024. Assuming that the build out of data centres would be copper intensive, and already well versed in the consensus logic that the red metal was heading into a structural deficit fuelled by the increasing demands of decarbonisation and electrification, hedge funds piled into the nearby COMEX July contract, forcing the physical traders to buy back their shorts at ever higher prices.
Chart 2: US copper prices ($/lb) and Nvidia stock
Short squeezes can only materialise if there is a lack of physical metal for those holding sell contracts to deliver against into exchange warehouses, thereby closing out their futures positions. So why were these experienced industry experts so exposed in the first place?
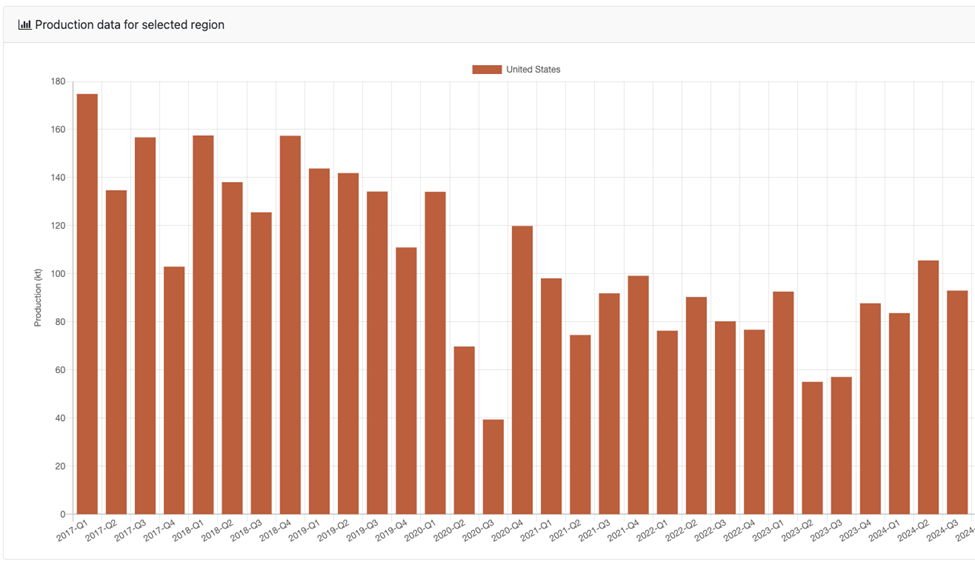
In this instance, the physical traders had been relying on shipments from South America to ‘cover’ their shorts, which were delayed due to a drought that had forced authorities to restrict shipping levels through the Panama Canal. But this was only the catalyst behind a much deeper structural shift that had long sown the seeds for events in May. As users of the SAVANT platform could see, copper production in the US has been in a steady decline, from an average of 142 kt/quarter in 2017 to only 94 kt/quarter in 2024 (see Chart 2). Therefore the US has become increasingly dependent on imports, and by association, inter-continental supply channels. Of course this is the domain of the commodity trader, who must compete and take risk in order to profit from geographical, as well as temporal and quality, arbitrages. As a result the risk profile of the regional market has been growing for many years.
Chart 3: SAVANT production beta (kt copper), USA (quarterly 2017 – 2024)
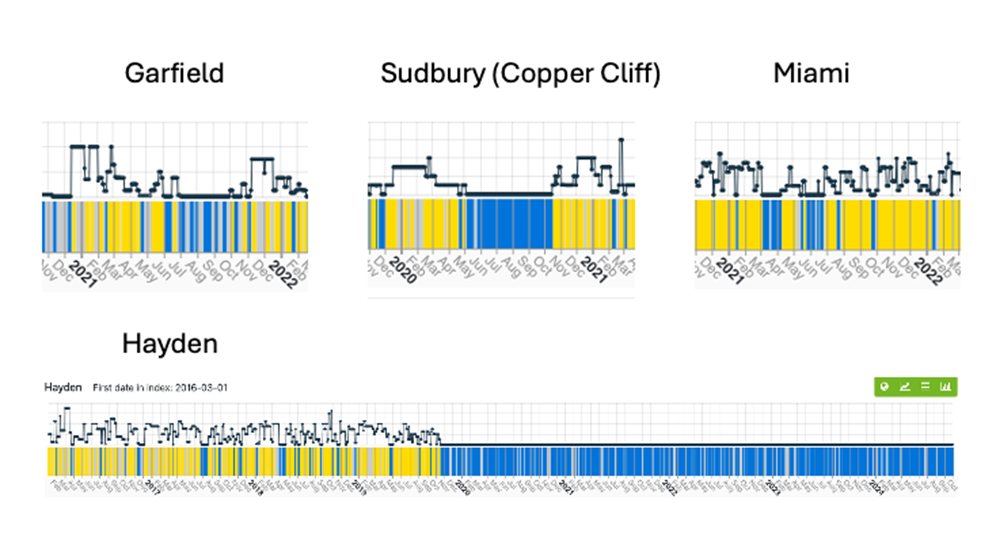
Indeed May’s events were not without precedent: in July 2021 the front month COMEX contract moved to a then record premium above prices on the LME for very similar reasons. At that time, the North American market also found itself short of locally produced metal. Extended downtime at Rio Tinto’s Garfield smelter (following an earthquake in March 2020) and also at Freeport’s Miami through Q2 2021, strike action at Vale’s Copper Cliff starting in June 2021 and the closure of ASARCO’s 160 kt/a Hayden following a labour strike were all contributors (see Chart 4). Back then the catalyst was the worst snarl in international logistics since the standardisation of modern container shipping over 50 years ago.
Chart 4: SAVANT inactivity profiles (yellow = active, blue = inactive), selected sites in North America, 2020 – 2021
So, can we expect this to become a feature of the copper market?
In addition to the decline in local production and the rise in risk associated with traders’ involvement in the North American market, there are two further reasons why we believe such spikes are more likely that in the past. Firstly, the ongoing ban on the import of Russian-origin copper (as well as aluminium and nickel) by the US will reduce overall material available for consumption, while the joint action of the CME and LME to block delivery of Russian brands into their systems, will continue to prevent traders from being able to use this metal to cover short positions.
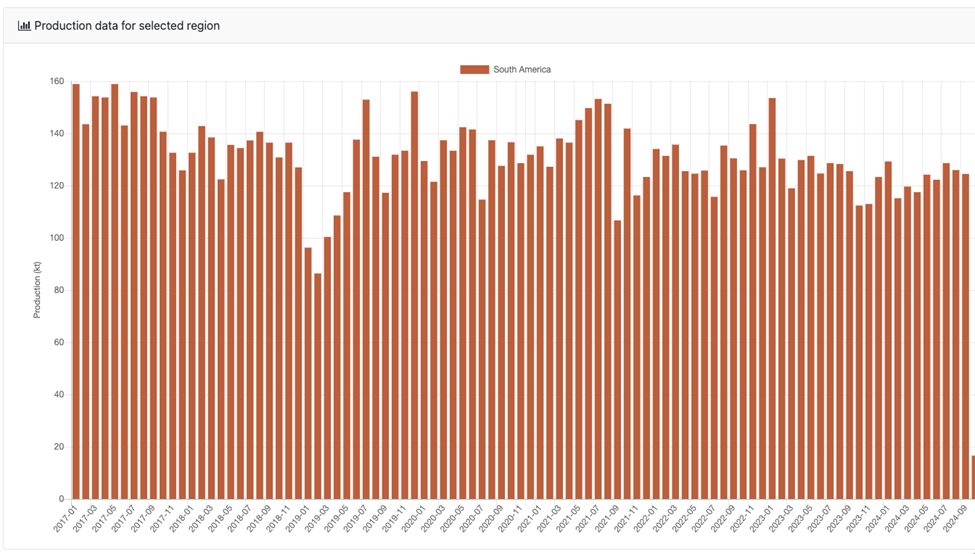
As such it seems the US will become ever more dependent on copper coming from South America. However, here too refined copper output is waning – average production has fallen from 148 kt/month in 2017 to 123 kt/month this year (see Chart 5), in large part due to the closure of Codelco’s 120 kt/a Las Ventanas plant in May 2023.
For these reasons, we believe the likelihood of future price spikes on COMEX is greater than in the past – even before considering the seemingly increased threat that extreme weather events in the Gulf of Mexico and on the US Eastern seaboard pose. We recommend those involved in the North American copper market would be wise to keep a very close eye on SAVANT’s real-time production series before entering into commercial positions.
Chart 5: SAVANT production beta (kt copper), South America (monthly, 2017 – Present)
If you would like to find out more about SAVANT and how you can subscribe, please email savant@earthi.space or call +44 (0)333 433 0015.
About SAVANT:
Earth-i’s SAVANT platform monitors up to 95% of the smelting capacity for copper and nickel around the globe and provides indicators of smelter activity and production around the globe, in an easy-to-understand format, covering multiple metals and minerals.
Data is collected and analysed using advanced algorithms derived from Computer Vision and Machine Learning techniques. Data is taken from several different Earth Observation satellites and our global and regional indices are updated at a high frequency to give consistent, insightful and dependable results.
Activity is scientifically measured using a consistent methodology. Over eight years of historical data is available.
About Earth-i:
Earth-i is a geospatial intelligence company using machine learning, artificial intelligence and Earth Observation data to provide unique and relevant insights, derived from diverse geospatial data, that deliver clear decision advantage for businesses, governments and other organisations.
Earth-i provides advanced analytics using automated interpretation of a range of geospatial Earth Observation data sources including colour imagery, colour video, infra-red and radar from a range of sources including satellite, drone, aerial and ground-based sensors. This data is fused with additional data sources to extract factual understanding and generate predictive insights across a range of markets such as commodities, supply chain, agriculture, infrastructure and defence.
#CopperProduction #CopperSmelting #CriticalMaterials