14 February 2025 – London – Over the last decade it is no exaggeration to say that the world has witnessed a revolution in analytics as rapid increases in computing power, combined with the availability of big data, has democratised information. For most of the twentieth century traders in commodity markets were predominately either specialists on futures exchanges (like Randolph and Mortimer Duke in ‘Trading Places’) or physical traders, able to use the prevailing lack of transparency, together with their own superior market intelligence gleaned from a network of employees and contacts that reached into the corners of the globe, to devise and execute strategies that few others could replicate.
Fast forward to today and much has changed. Traders still play an important role, however they must work harder for their advantage. Not only has competition increased – the number of physical traders now involved in the copper concentrates market is a good example – but also in light of tools like Earth-i’s SAVANT platform that has brought visibility to remote locations, as we highlighted in our recent article ‘Copper’s final frontier‘. And for those trading copper futures for the red metal’s ability to forecast the business cycle – a position that has earnt it the moniker ‘Dr. Copper’ – SAVANT provides a crucial micro level understanding of the supply chain to complement their macroeconomic view.
‘Metadata’ is a word that has entered the industry lexicon in recent years in (sic. slightly mislabelled) reference to data derived from data. In the case of SAVANT, this allows the user to take any number of individual activity observations, covering more than 90% of copper smelters around the world, and interrogate these at a higher level to surface patterns of behaviour – either globally, by smelter type or by geographical region. But as anyone who has worked with big data knows, this is not easy – even assuming that a signal exists, more often than not these are imperfect and fleeting.
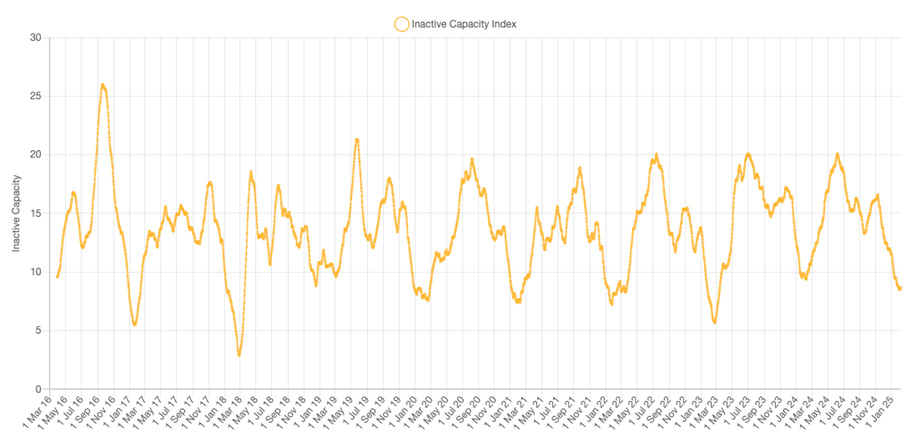
And that is why SAVANT data is wonderfully peculiar. For example, looking at the 30 day moving average of the Global Inactivity Capacity Index, this displays a consistent annual cycle of smelting activity that rises into the end of the calendar year (as denoted in the Chart 1 by inactivity declining), before falling sharply throughout the second quarter.
Chart 1: SAVANT Global Inactive Capacity Index, Mar 2016 – Present
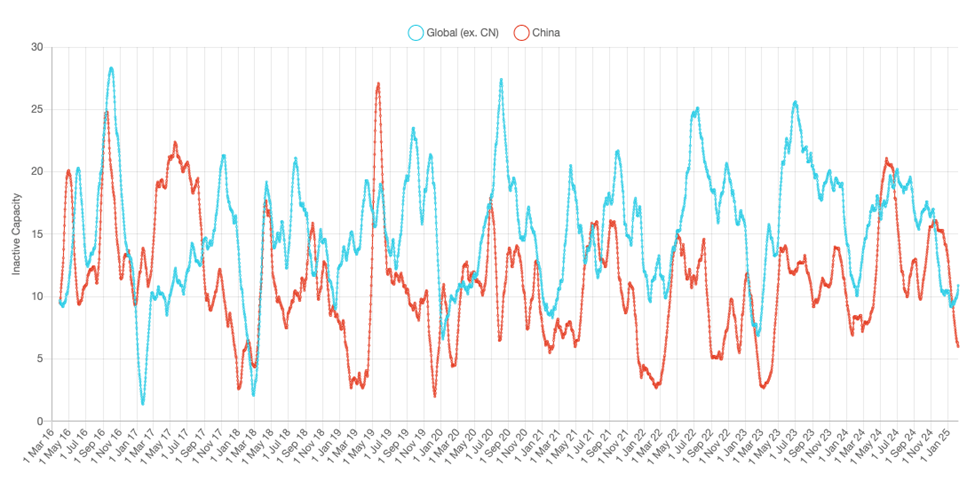
To those familiar with the copper industry in China this intuitively makes sense – as we pointed out in our January Press Release, such an ebb and flow is consistent with the timing of Chinese New Year. However what is really interesting is that when separating Rest of World (RoW) from China, the same pattern is evident. Indeed to borrow from statistics, the correlation between the RoW and global series across the nine year history is actually stronger at 0.88 compared to only 0.58 for China*.
Chart 2: SAVANT RoW and China inactivity indices, Mar 2016 – Present
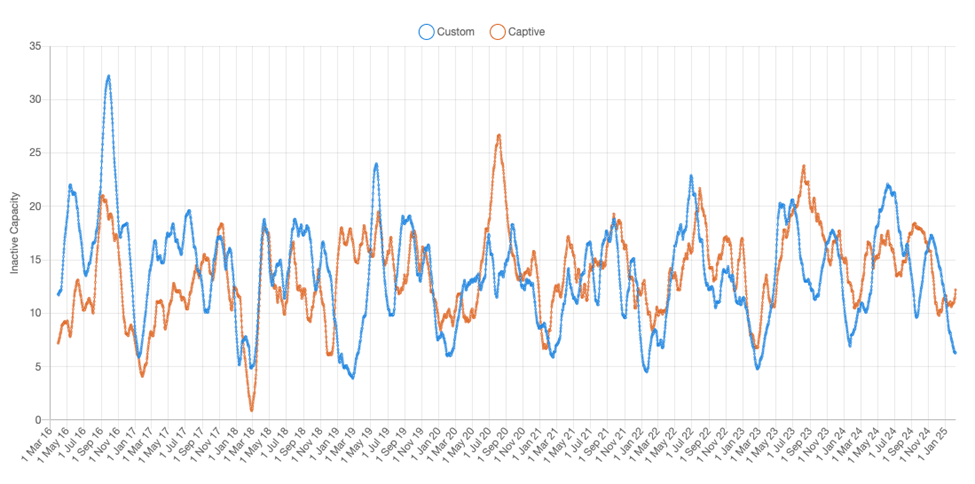
Furthermore, the metrics for custom and captive smelters are also remarkably similar at 0.84 and 0.75 respectively. It is not surprising that the correlation of custom smelting activity with the global series is high. These operations are most exposed to the rhythms of economic activity across the calendar year and especially the spring thaw in the northern hemisphere, when economic activity for the majority of the world’s largest economies picks up (note: this is the same phenomena that is responsible for the age old adage on the London Metal Exchange ‘sell in May and go away’, timed with the release of positive m/m data). But for RoW / captive smelters to also display similar patterns of behaviour suggests that there is something almost visceral in nature in play, as the consensus logic is that these plants should be largely ‘immune’ from such fluctuations, instead operated as through-the-cycle processors of material received from the mines which they complement as part of an integrated supply chain.
Chart 3: SAVANT custom and captive smelter inactivity indices, Mar 2016 – Present
And not only do the relationships repeat, but they have strengthened with the passage of time. This cannot be explained by falling volatility, which has remained largely stable. Therefore, even before finessing the data for the optimal lags and lookbacks, these SAVANT series present as strong candidates for inclusion in algorithmic trading models, which look to select data sets in combination to minimise prediction errors. This could be against the copper price, but from the evidence above, could equally have utility in macro trading strategies outside commodities. That should reassure those who are still wary of the Duke brothers and their attempt to corner the frozen OJ market.
* – Correlations are for comparative purposes only between ‘child’ series as we acknowledge the self-reinforcing nature of correlation between component series and the global ‘parent’.
If you would like to find out more the Copper sites above, or about SAVANT and how you can subscribe, please email savant@earthi.space or call +44 (0)333 433 0015.
About SAVANT:
Earth-i’s SAVANT platform monitors up to 95% of the smelting capacity for copper and nickel around the globe and provides indicators of smelter activity and production around the globe, in an easy-to-understand format, covering multiple metals and minerals.
Data is collected and analysed using advanced algorithms derived from Computer Vision and Machine Learning techniques. Data is taken from several different Earth Observation satellites and our global and regional indices are updated at a high frequency to give consistent, insightful and dependable results.
Activity is scientifically measured using a consistent methodology. Over eight years of historical data is available.
About Earth-i:
Earth-i is a geospatial intelligence company using machine learning, artificial intelligence and Earth Observation data to provide unique and relevant insights, derived from diverse geospatial data, that deliver clear decision advantage for businesses, governments and other organisations.
Earth-i provides advanced analytics using automated interpretation of a range of geospatial Earth Observation data sources including colour imagery, colour video, infra-red and radar from a range of sources including satellite, drone, aerial and ground-based sensors. This data is fused with additional data sources to extract factual understanding and generate predictive insights across a range of markets such as commodities, supply chain, agriculture, infrastructure and defence.
#CopperProduction #CopperSmelting #CriticalMaterials