15 May 2025 – London – At the beginning of the last decade, Indonesia was primarily known in commodity markets for its place as the world’s largest exporter of palm oil and second largest exporter of coal. Yes, it had a good endowment of minerals, most notably at Grasberg in the mountains of Central Papua that was said to be ‘the most profitable in the world’. But despite this, as well as being home to some of the world’s highest grade nickel ore, the contribution from metals to the country’s economy was only a tenth of that of its two major exports.
However, the seeds of change had already been sown with the emergence of China’s nickel pig iron (NPI) industry that grew early in the 2010s following the price spike that took class 1 nickel on the LME above $50,000/t in 2007. This proved the mother of invention, as nimble Chinese operators were able to conduct pilot scale testing at a scale and speed (and at an ESG standard) unmatched in traditional jurisdictions, to meet rapidly expanding stainless steel demand from the kitchenware, machinery and equipment sectors riding on the back of a buoyant domestic housing market.
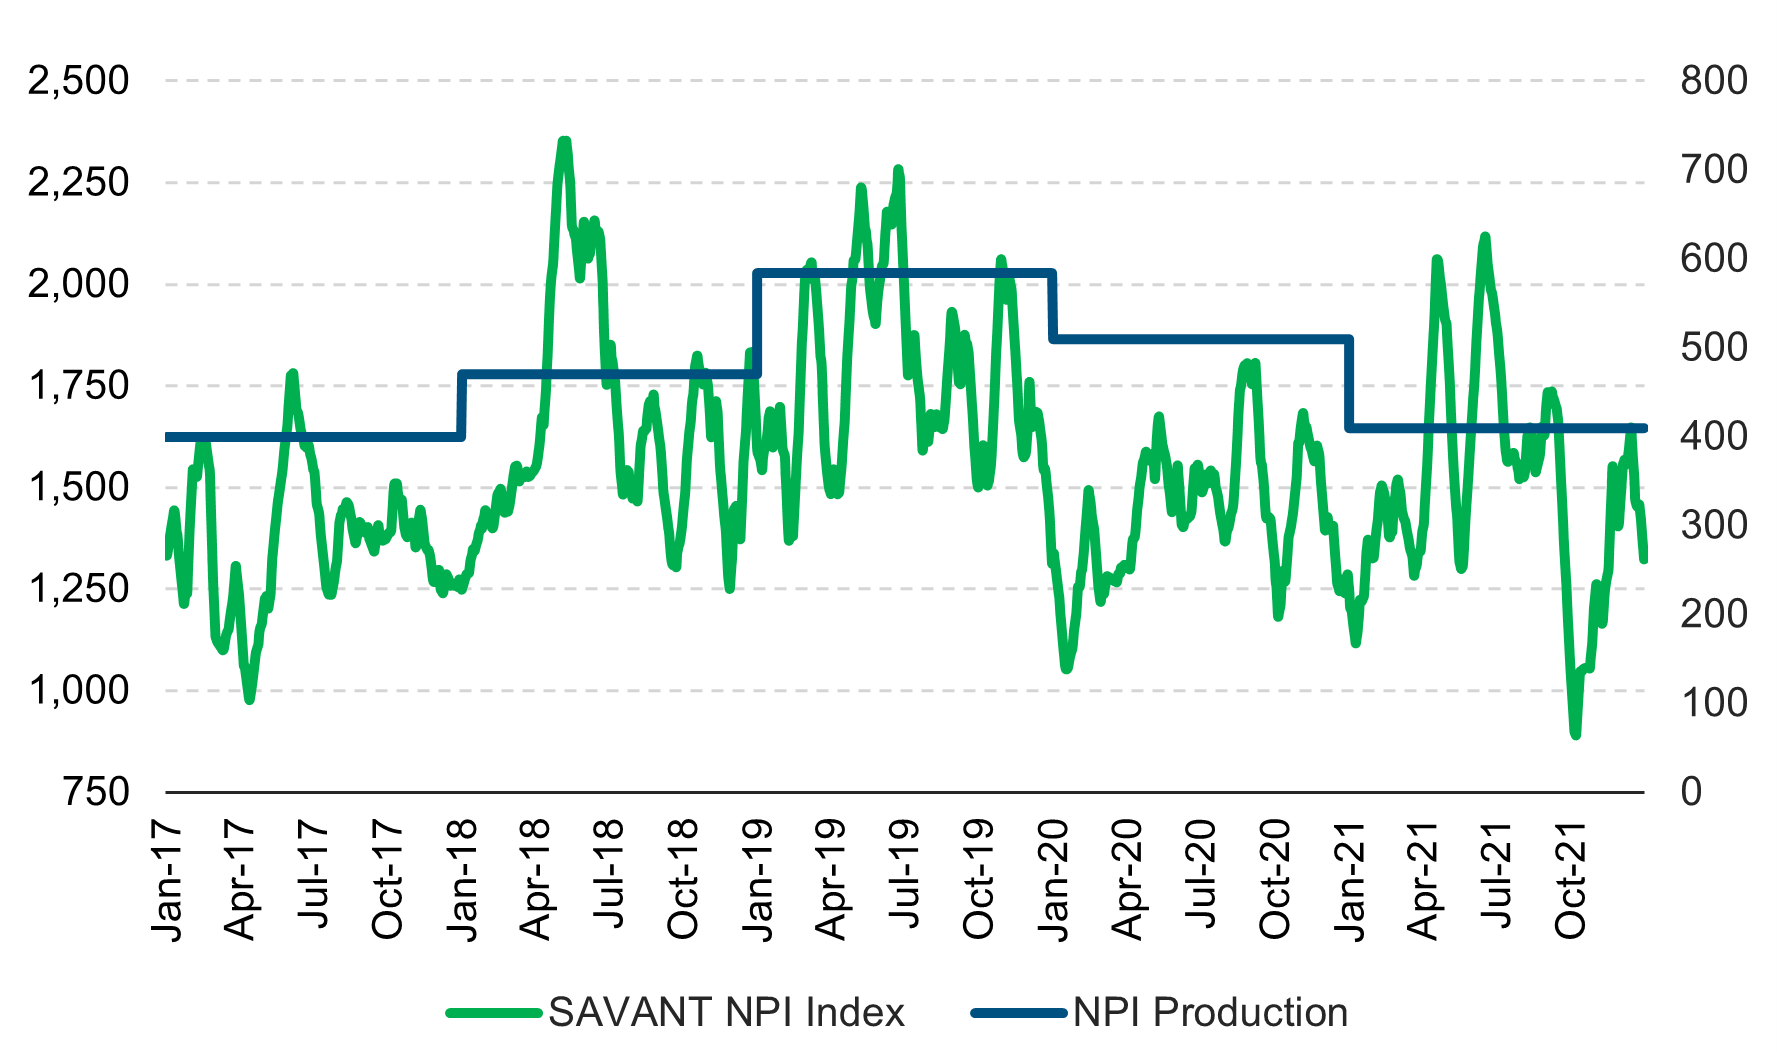
The NPI industry was opportunistic in its infancy, so that most plants were in private hands, tacked onto the front of stainless mills and not of the size to necessitate public disclosure. This made quantifying production very difficult … until Earth-i’s SAVANT platform started monitoring these sites in 2016. By collecting site-specific data and then calibrating the heat signatures from the rotary kiln electric furnace (RKEF) technology these sites employ, subscribers were able to get a proxy for Chinese NPI production – the swing factor in the market at the time – in real-time (see Chart 1).
Chart 1: SAVANT capacity weighted index of NPI sites in China, July 2016 – December 2021
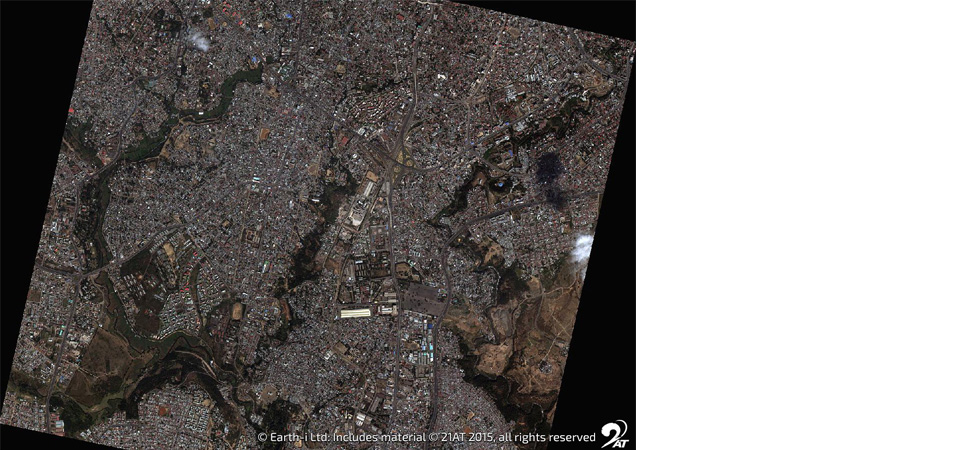
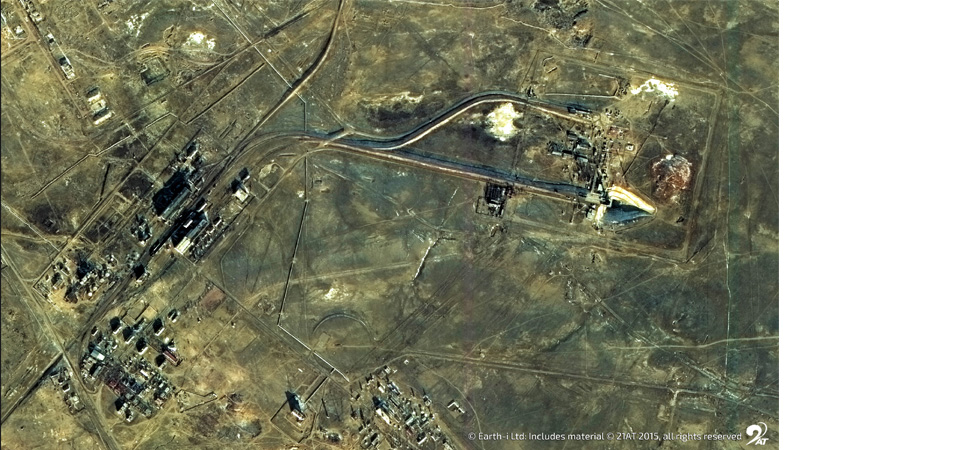
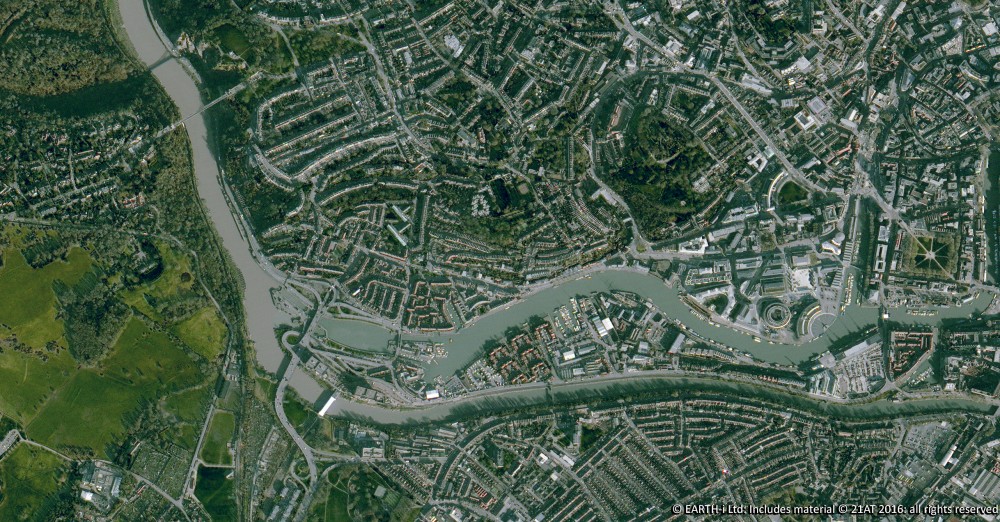
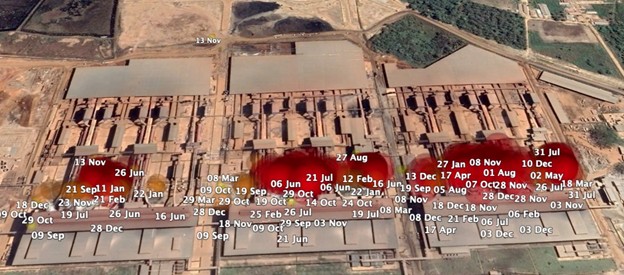
The only catch (the doomsday machine as it were) was that these plants were almost entirely dependent on imported laterites from Indonesia, a fact not lost on President Yudhoyono who would ban the export of unprocessed nickel and bauxite ores in 2014, seeking to extract additional rents from onshore value-adding. His legacy, as well as that of his successor President Widodo, in transforming the country’s nickel industry is assured with the buildout of processing capacity propelling Indonesia to becoming the world’s preeminent producer of ‘devil’s copper’. And of course, monitoring this paradigm shift has been SAVANT, observing the ramp up of transformational projects like PT Virtue Dragon’s 120 kT/a Delong (see Figures 1, 2 & 3 below). Additionally, because plants like Delong operate at enormous scale, with 15 RKEF lines, it is equally important to have visibility not just at a site level, but at a line level. This is possible using our platform that utilises computer vision and machine learning techniques so that each site undergoes characterisation mapping that is constantly updated.
Figures 1, 2 & 3: SAVANT activity signals at the Delong NPI Project, February 2018 – February 2020
Figure 1 – February 2018
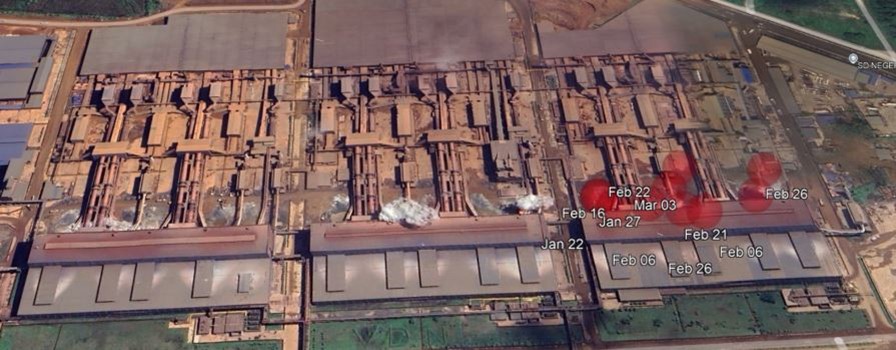
Figure 2 – February 2019
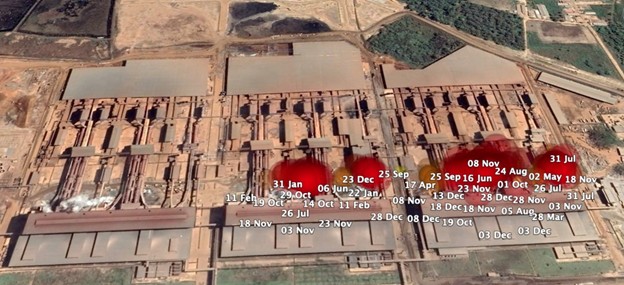
Figure 3 – February 2020
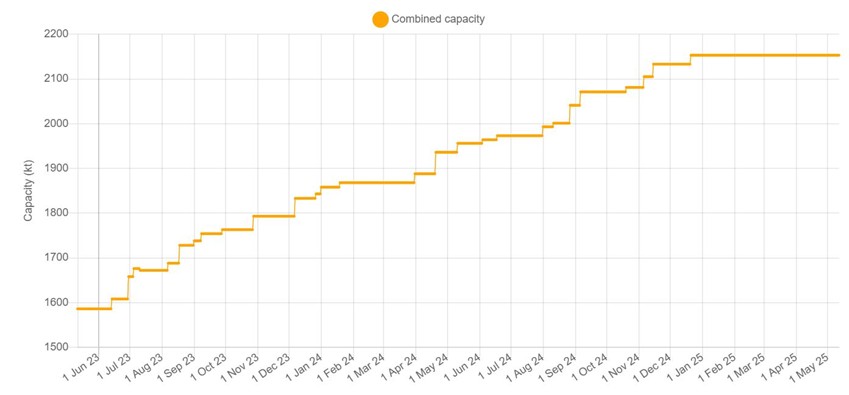
Fast forward to today and Indonesia’s position as the world’s dominant producer of nickel continues to grow, with the country now accounting for 61% of global refined nickel supply. Indeed, in excess of half a million tonnes of additional capacity have been added in the last 18 months (see Chart 3), with our monitoring now extending to 59 sites across the archipelago. As such, the ramp up of the new Huabao Industrial Park together with lines on Obi Island promise to be equally as important to the market as those first-generation plants at the Morowali and Weda Bay Industrial Parks (IMIP & IWIP), or the 192 kT/a, 24-line, PT Gunbuster.
Chart 3:SAVANT nickel capacity in Indonesia, June 2023 – Present
For context, the International Nickel Study Group (INSG) is forecasting a global market surplus this year of 170,000 tonnes. Behind this likely lies a ‘best guess’ estimate of Indonesian nickel output, while similarly most industry consultants only have a ‘bucket’ to which production is allocated, given their adherence to the same traditional data collection methods which hampered their efforts to quantify the build out of the NPI industry in China more than a decade ago. Add to this the uncertainties around the issuance of new mining quotas that have driven ore prices higher, declining grades as higher qualities are exhausted and the increasing prevalence of NPI to matte conversion, and the situation is likely to only become ever more opaque. However, as a snapshot of signals from 3 of the 17 plots at Weda Bay below show (see Chart 4), SAVANT has unmatched visibility into the operating activity across more than 250 RKEF lines, a level of granularity that will allow us to replicate our capacity weighted China production index.
Chart 4: Activity signals at Weda Bay Industrial Park, selected plots, June 2023 – Present
Plot ‘#1’
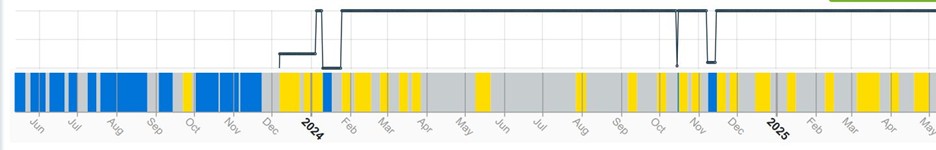
Plot ‘#2’
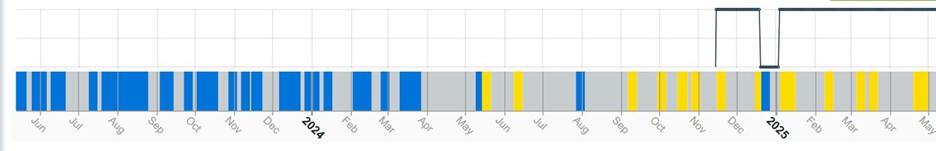
Plot ‘#3’
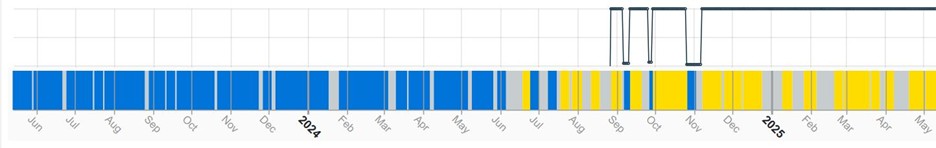
Blue = inactive, grey = no reading, yellow = active
Space-derived, AI-driven geospatial analytics is now a proven, accurate and accepted data layer in the finance and commodity industries. With the benefit of there being no privacy from space, this brings a homogenous transparency across the globe, as well as a level of detail not previously possible.
Although the stakes may not be quite as high as the inhabitability of the Earth for the next 93 years, we would wager that General ‘Buck’ Turgidson would have been an early SAVANT adopter to satisfy his desire to only make a judgement once all the facts are in.
About SAVANT:
Earth-i’s SAVANT platform monitors up to 95% of the smelting capacity for copper and nickel around the globe and provides indicators of smelter activity and production around the globe, in an easy-to-understand format, covering multiple metals and minerals.
Data is collected and analysed using advanced algorithms derived from Computer Vision and Machine Learning techniques. Data is taken from several different Earth Observation satellites and our global and regional indices are updated at a high frequency to give consistent, insightful and dependable results.
Activity is scientifically measured using a consistent methodology. Over eight years of historical data is available.
About Earth-i:
Earth-i is a geospatial intelligence company using machine learning, artificial intelligence and Earth Observation data to provide unique and relevant insights, derived from diverse geospatial data, that deliver clear decision advantage for businesses, governments and other organisations.
Earth-i provides advanced analytics using automated interpretation of a range of geospatial Earth Observation data sources including colour imagery, colour video, infra-red and radar from a range of sources including satellite, drone, aerial and ground-based sensors. This data is fused with additional data sources to extract factual understanding and generate predictive insights across a range of markets such as commodities, supply chain, agriculture, infrastructure and defence.